Search the documentation
Enter at least 2 characters
Enter at least 2 characters
 |
CAE Fidesys 9.0 Documentation |
The Statistics filter allows you to obtain statistical data for selected arrays in tabular form. The table displays data such as:
"Number of entities" shows the number of entities that were taken into account in collecting statistics;
"Maximum" - the maximum value of the array;
"Average" - the average value of the array;
"Minimum" is the minimum value of the array;
"Sum" is the result of adding all the values of the array.
The filter can be applied to the pvd-file itself, as well as to other filters.
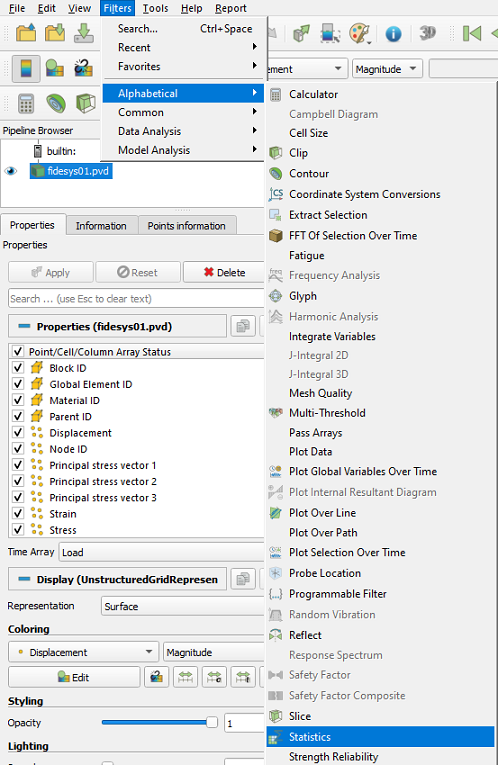
To use this filter, select Filter - Alphabetical - Statistics in the top line.
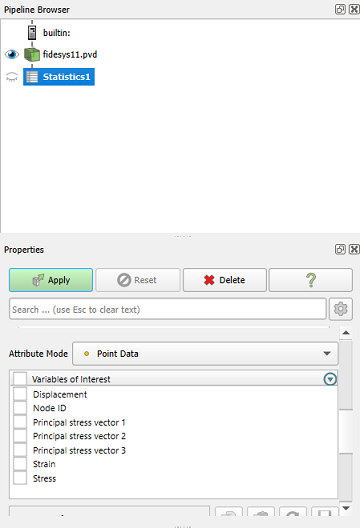
In the filter that appears on the Properties page, using the scroll bar, select the variables you want to continue working with (select some of the available ones, select all by checking the Variables of interest box).
After pressing the Apply button, the screen will be divided into two parts: the results of the calculation in graphical form with an image of various isofields (was before applying the filter) and a table containing statistical data.
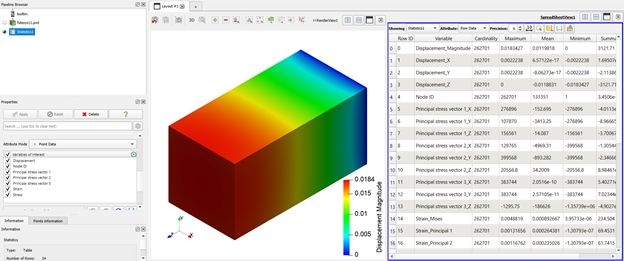
As shown in the image above, the table is outlined in blue, which indicates that interaction with this table is currently in progress. To interact with the model, you should click on it, as a result of which the outline of the model screen will turn blue.
The variables you are working with can be enabled and disabled as you go. To do this, on the Filter Properties page, check or uncheck the boxes next to the required variables and click the Apply button - the table will be updated automatically.
A step-by-step example using the Statistics filter is in the articles: «Automated Creation of Connections between Hole Lines and Vertices» and «Safety Factor (Hooke-Brown criterion)».