Search the documentation
Enter at least 2 characters
Enter at least 2 characters
 |
CAE Fidesys 9.0 Documentation |
Here you can see:
Linear spectral analysis in CAE Fidesys takes place in several stages, in addition to creating a model:
To perform linear spectral analysis, it is necessary to prepare a file in *.csv format with a response spectrum. The file should contain a table where the values of frequency (Hz) are placed in the first column , and movements (speeds, accelerations) are placed in the subsequent columns. You must specify the column names:
Example of setting the response spectrum of movement along the axes Ox, Oy, Oz in the *.csv file:
| f | dx | dy | dz |
|---|---|---|---|
| 0.875 | 1.05E-01 | 2.02E-01 | 5.01E-01 |
| 2.667 | 3.40E-02 | 4.05E-02 | 5.01-02 |
Note: Microsoft Excel can open a csv file in this form:
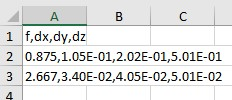
that is, without splitting the file into columns and listing the values of the lines of the file separated by commas.
To divide the test in rows according to the corresponding columns, it is necessary to put a comma in the list item separator settings of your operating system.
It is worth noting that if the settings are not changed, the file will be downloaded incorrectly.
The response spectrum is applied to the model in the Fidesys Viewer program.
Select on the Command Bar Mode - Calculation Settings, Calculation Settings - Spectrum Analysis.
Among the spectral analysis settings, select the icon  (General).
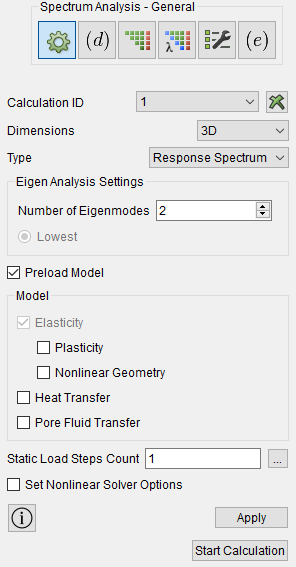
In the Dimensions drop-down list, select the dimension of the problem to be solved: 3D (three-dimensional; default) or 2D (flat).
In the Type group, specify the required type of spectral analysis (Response Spectrum or Random Vibration).
In the Settings group, specify the data required for the calculation: the number of natural frequencies to be determined.
In the case of analyzing vibrations of a pre-loaded structure, check the Preload model box, and in the Model group that opens, specify the features of such loading (Plasticity, Nonlinearity geometric, Heat transfer, Pore Fluid Transfer).
Click Apply.
After completing the modal calculation, go to FidesysViewer using the key combination Сtrl+E.
In the main menu, go to the tab Filters - Alphabetical- Responce Spectrum.
In the appeared window of calculation results properties the following settings are available:
Point values to process;
Total values to process;
Choose a mode combination method:
- absolute sum;
- square root of the sum of squares;
- complete quadratic combination;
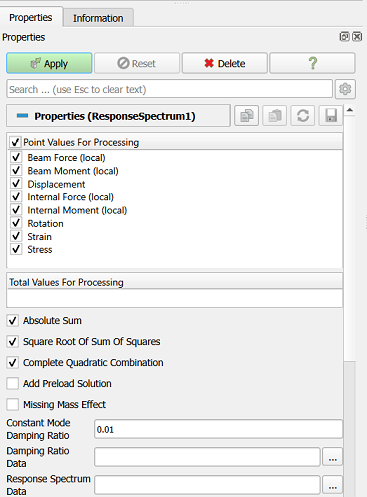
After setting all the settings, click Apply.
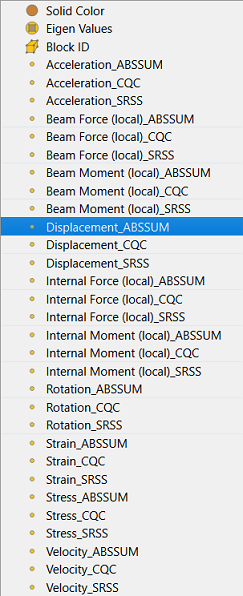
Next, you will be able to build the necessary diagrams by selecting them in the drop-down list of results. For example, the displacements obtained by the "Absolute sum" method will be available under the name Displacement_ABSSUM.