Search the documentation
Enter at least 2 characters
Enter at least 2 characters
 |
CAE Fidesys 9.0 Documentation |
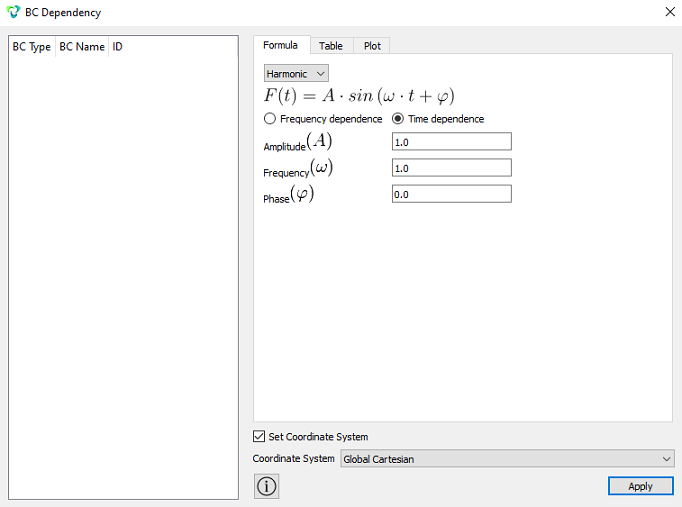
Frequency analysis is an analysis used to calculate the response of a system on a frequency range to a sinusoidal action (displacement, acceleration, force, pressure), unchanged at a constant frequency. The sinusoidal nature of the loading can be set using Mode - BC Dependence - Harmonic.
Here you can see an example of calculation using MPI.
Frequency analysis is launched from the Command Panel (it is assumed that the user has already built a finite element model of the analyzed object, set the boundary conditions and loads changing according to the harmonic law):
Select Mode - Calculation Settings.
In the calculation settings, select the type of calculation: Frequency Analysis.
Among the frequency analysis settings, select the icon  (General):
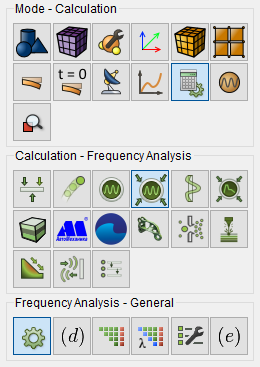
Fig. 1 - Command panel, general settings for frequency analysis
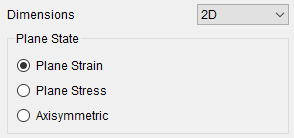
In the drop-down list Dimension select dimension the problem to be solved: 3D (three-dimensional; by default) or 2D (plane).
In the case of 2D in the radio button group Plane state select Plane strain or Plane stress:
Formefrequency analysis is carried out by the mode superposition method, therefore, it is necessary to first conduct a modal analysis of the structure.
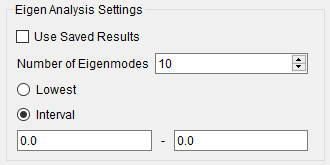
First of all, it is necessary to set the eigen analysis settings.
There are two options for finding natural frequencies:
The method of the least natural frequencies. This method has an advantage over the search for natural frequencies on the interval, since it takes less time to calculate. However, it should be checked that the last calculated frequency is higher than the range of frequency calculation. For the method of the least, the default value will be calculated as 10 MF.
The interval method allows you to specify the frequency search range. It is recommended to set the modal analysis interval wider than the frequency analysis, as there may be boundary modes that affect the response of the system in the frequency analysis area. For the interval method, the default value will be calculated as an interval from 0 to 100.
Next, you need to set the frequency analysis settings.
Methods of frequency distribution in harmonic analysis:
Uniform.
Uniform with eigen values – in this method, in addition to the frequencies that fall within the uniform step settings, the algorithm will perform a calculation for each natural frequency.
Auto (Resonance method) - in this method, the algorithm based on the MF will distribute steps concentrated around the MF based on the total number of specified steps.
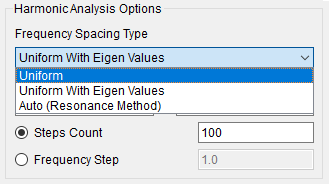
Enter:
Frequency interval;
Number of steps by frequency or Frequency step (using the appropriate radio button).
In case of vibration analysis of a pre-loaded structure, check the Pre-loaded
model box, and in the Model group that opens,
specify the features of such loading (plasticity, geometric nonlinearity,
thermal conductivity, piezoconductivity).
Notes:
1. Since the superposition method is used, a preliminary determination
of the natural frequencies and vibration modes of the analyzed structure
is required. If they have not been previously determined, the program
recognizes the situation and launches the corresponding calculation automatically.
2. The case of preloading of the structure is handled in a similar manner.
By default, its operation in the elastic region is considered. If the
preloading features include plasticity or geometric nonlinearity, then
the Specify nonlinear solver settings checkbox should
be checked and they should be carried out as described, for example, in
the subsection Static
strength calculation.
Click Apply
Further settings are made as follows:
On the Command Bar, among the frequency analysis settings, select
icon  (Frequency Analysis - Damping).
This opens the input windows in which you need to set the appropriate
values:
(Frequency Analysis - Damping).
This opens the input windows in which you need to set the appropriate
values:
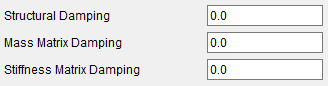
Click Apply.
Then you can click Start the Calculation, however,
at the user has the opportunity to conduct additional if desired settings.
To do this, on the Command Panel, among the frequency settings for
analysis, select the icon  (Frequency Analysis
- Solver) and perform the necessary settings
the system of linear equations solver (System of linear equations
is a system of linear algebraic equations).
(Frequency Analysis
- Solver) and perform the necessary settings
the system of linear equations solver (System of linear equations
is a system of linear algebraic equations).
If, after performing the settings of the system of linear equations
solver, you did not click on the same panel Start the Calculation,
then you can do it now. But you can also make additional settings
of the solution problems of eigenvalues. To do this, on the Command
Panel among the settings for frequency analysis, select the icon  (Frequency Analysis - Eigen Solver)
and perform required solver
settings.
(Frequency Analysis - Eigen Solver)
and perform required solver
settings.
If necessary, configure the output fields of the calculation results (Frequency Analysis - Output Fields):
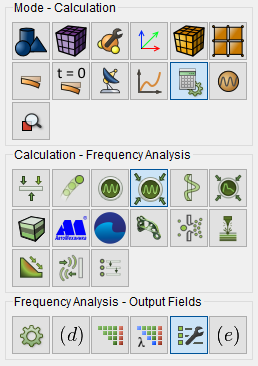
Fig. 2 - Command Panel, output field settings for frequency analysis
You can leave the default settings.
Click Apply.
Click Start Calculation.
In a pop-up window select a folder to save the result and enter the file name.
In the case of a successful calculation, the console displays the message: Calculation finished successfully at "date" "time".
To display the calculation results, you can use the icon  (Open
the results of the last calculation). When you click the Fidesys postprocessor
is launched on this icon: FidesysViewer.
(Open
the results of the last calculation). When you click the Fidesys postprocessor
is launched on this icon: FidesysViewer.
To plot the frequency dependence after the calculation using frequency analysis, select Filters → Alphabetical → Frequency analysis. Specify the node number, characteristics which will be presented on the graph.
You can see an example of this calculation here: