Search the documentation
Enter at least 2 characters
Enter at least 2 characters
 |
CAE Fidesys 9.0 Documentation |
The "Plot Internal Resultant Diagram" filter is used to plot
internal forces and moments on beam elements. The plots can be reoriented
and scaled for easy display. To correctly select all beam elements, you
must use the cell selection tool  .
.
The filter works with beam elements, even if the beam elements share nodes with three-dimensional elements. As a result of the filter operation, diagrams of internal moments and forces are visually displayed on the selected elements of the beams, depending on the user's choice.
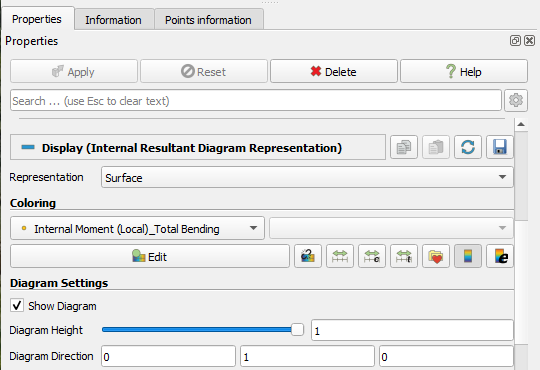
The plots of the entity are displayed on the model in 3D. The display of entity (height and direction of the diagram) can be adjusted using the Diagram Height and Diagram Direction functions. The diagrams are constructed in the beam coordinate system. In the beam coordinate system, the X-axis is always directed along the beam curve. Diagram Height is a scalar value and determines the scale of the fields display.

In the Coloring tab, you can select the force or moment component to plot from the drop-down list: longitudinal, transverse, and total transverse for force, and bending, torsional, and total bending for moment.
To use this filter, select the cells of the input dataset using Select Points Through, click Apply and set the display parameters.
Examples of how the filter works Plot Internal Resultant Diagram:
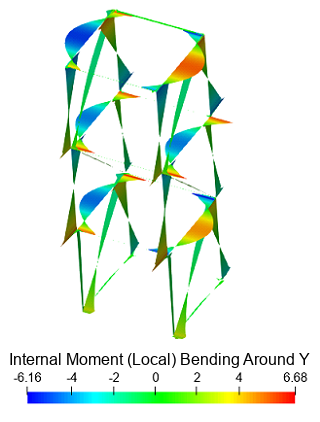
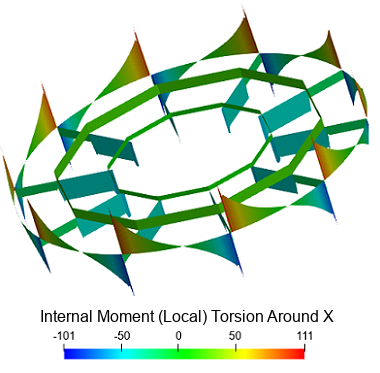
Here you can see an example of the calculation.