Search the documentation
Enter at least 2 characters
Enter at least 2 characters
 |
CAE Fidesys 9.0 Documentation |
To tell FidesysViewer that a data array should be viewed as categories to color, check the Interpret values as categories" in the color map editor panel. Once this checkbox set, the panel switches to categorical mode: data group mapping is hidden and the annotation group becomes an unexpanded group, i.e. the annotation widget is displayed even if the panel does not display additional properties as shown in Figure 11.
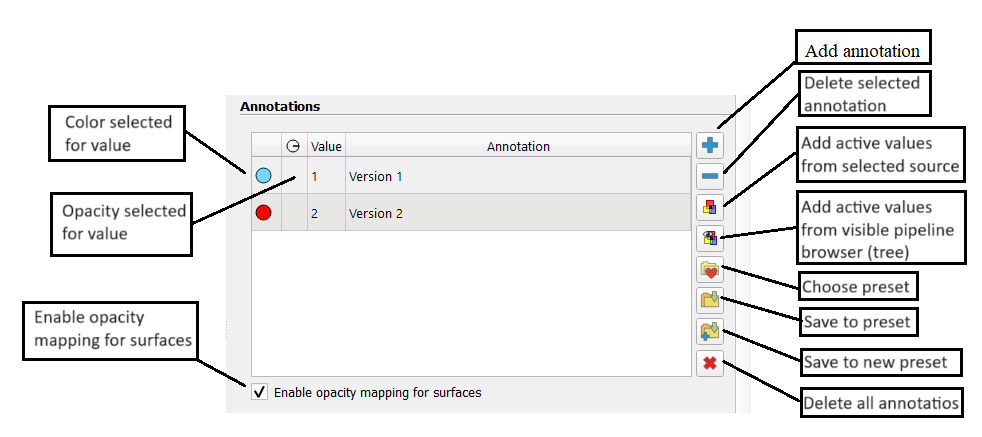
Figure 10. Color map editor by default when the Interpret values as categoriescheckbox is selected
The annotation widget will still show any annotations that may have been added previously, or it may be empty if nothing was added added. You can add annotations for data values like this before using the buttons on the side of the widget. However, this time in every entry The annotations also have a column for color.
If no color was specified, a question mark icon will appear; otherwise In case a color swatch will be shown. You can double click the sample colors or a question mark icon to indicate the color that will be be used for this entry.
In addition, you can choose from a predefined set of categorical color
maps by clicking the  . As before, you can use the
key to edit and add multiple values. Therefore, you can first add all
the values of interest for one pass and then select a preset color map
to install colors for added values. If the preset has fewer colors than
in annotated values, then the user may have to manually set the colors
for these additional annotations.
. As before, you can use the
key to edit and add multiple values. Therefore, you can first add all
the values of interest for one pass and then select a preset color map
to install colors for added values. If the preset has fewer colors than
in annotated values, then the user may have to manually set the colors
for these additional annotations.