Search the documentation
Enter at least 2 characters
Enter at least 2 characters
 |
CAE Fidesys 9.0 Documentation |
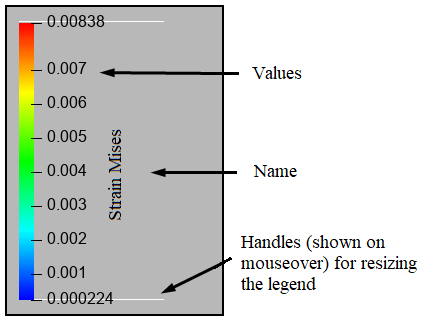
Figure 6. Color legend in FidesysViewer
Color legend, also known as scalar bar or color strip is designed to
provide the user with information about which color corresponds to which
data value in the visualization. You can toggle the visibility of the
color legend corresponding to the function transmission displayed/edited
in the color map editor using buttons at the top of the panel. This button
 affects
visibility of the legend in active form.
affects
visibility of the legend in active form.
Figure 6 shows the different components of a color legend. Default the header is usually the name of the array being displayed (and also component number or value for non-scalar data arrays). With one automatically created labels appear on the sides of the color legend, and the other side is annotations, optionally including start and end annotations showing the minimum and maximum range of color legends.
The color legend can be controlled with the mouse. You can click and Drag the legend to place it anywhere in the view. Besides, you can change the length of the legend by clicking and dragging the end handles, shown when you hover your mouse over the legend.