Search the documentation
Enter at least 2 characters
Enter at least 2 characters
 |
CAE Fidesys 9.0 Documentation |
Annotations allow users to place their own text within specific data values in the color legend. Mapped Value Annotations minimum and maximum data are added automatically. To add any other custom annotations, you can use the editor color card.
Since the annotation list is an extended property, you need or toggle
the visibility of additional properties using the  at the top part of the panel, or enter annotations in the search field.
This will show the widget Annotations, which is essentially a list widget
where users can enter key-value pairs rather than value-annotation pairs,
as shown in Figure 9.
at the top part of the panel, or enter annotations in the search field.
This will show the widget Annotations, which is essentially a list widget
where users can enter key-value pairs rather than value-annotation pairs,
as shown in Figure 9.
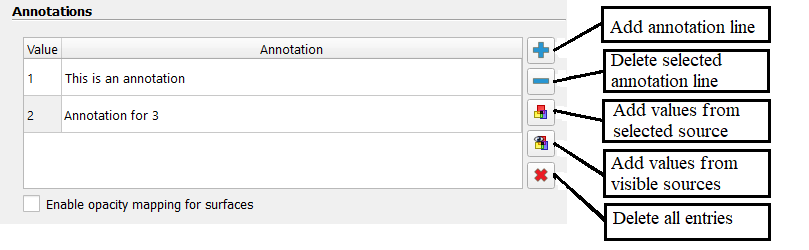
Figure 9. Widget for adding/editing annotations to the Color Editorpanel
You can use the buttons on the right side of the widget to add/remove records. Enter a data value for the annotation in the Value column, and then enter the text that will be displayed at this value in the column "Annotation".
You can use the (tab) key  for editing the next
entry. Clicking
after editing the last entry in the table will automatically result in
a new row being added, which will make it easier to add a group of annotations
without having to click any buttons.
for editing the next
entry. Clicking
after editing the last entry in the table will automatically result in
a new row being added, which will make it easier to add a group of annotations
without having to click any buttons.
Some annotation text may not appear in the legend. Annotations may not appear for two reasons. First, the number of characters the text being added is outside the function's display range color transfer. Secondly, in the Color Legend Options dialog box The "Display Annotations" checkbox is not selected.
Buttons  and
and  can
use to fill an annotation widget with unique discrete values from the
data array, if possible. Depending on quantity different values present
in the data array, this may not give no result (a warning message will
be shown instead). Data array values come either from the selected source
object, if you use the , or from visible source objects,
if you use the .
can
use to fill an annotation widget with unique discrete values from the
data array, if possible. Depending on quantity different values present
in the data array, this may not give no result (a warning message will
be shown instead). Data array values come either from the selected source
object, if you use the , or from visible source objects,
if you use the .