Search the documentation
Enter at least 2 characters
Enter at least 2 characters
 |
CAE Fidesys 9.0 Documentation |
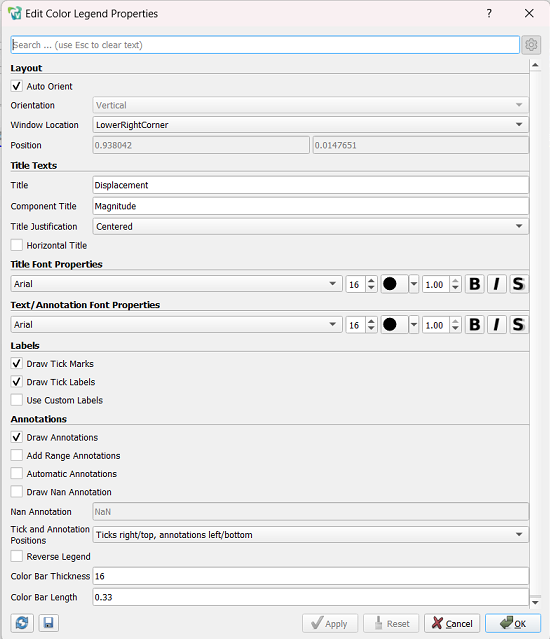
Figure 7. Edit dialog box color legend properties" in FidesysViewer
You can edit the color legend parameters by clicking the  on the
panel color map editor. The Edit Properties dialog box opens. Color Legend"
which will show the available options. Any the changes made will only
affect the legend of a certain color in the active form.
on the
panel color map editor. The Edit Properties dialog box opens. Color Legend"
which will show the available options. Any the changes made will only
affect the legend of a certain color in the active form.
The first few parameters control the orientation and placement of the color legends in the visualization view. includes automatic detection orientation of the color legend. The color legend will change orientation to horizontal, if you drag it to the bottom or top of the visualization view, and will change it to vertical if you drag it left or right. If this option is disabled, you can choose the orientation of the color legend, by selecting an option in the Tick and Annotation Location combo box.
The Window Position option controls the location of the color legend in the window; if Any Location is selected, color legend will not be forced to any specific position. Color the legend can be positioned by clicking and dragging it with the mouse in rendering, or the "Position" property can be specified explicitly with fractional coordinates in the range from [0, 1] and representing part of the width (or height) of the window, where the bottom left corner of the color legend should be placed. Please pay Please note that if a color legend is placed interactively using mouse, the Window Location option will automatically change to Any Location.
Besides the obvious change to the title text and font properties for the title, labels and annotations, there are some other options that control appearance of the color legend.
By default, the header is rotated 90 degrees counterclockwise arrows when legend is oriented vertically for better alignment with a legend. If you select the Horizontal Header checkbox, the header color legend will be horizontal regardless of color orientation legends.
"Display Annotations" determines whether to draw annotations (including starting and ending annotations).
If this checkbox is checked, "Display Nan annotation" causes that the color legend shows the NaN color set in the editor panel color map, in a separate color box right next to the color legend. The annotation text displayed for this field can be changed by changing annotation text Nan.
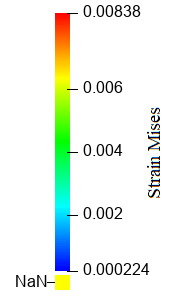
Figure 8. Color legend showing NaN's annotation
If the Automatic Annotations checkbox is selected, FidesysViewer will attempt to select the optimal representation of numeric values based on values and available screen space. By unchecking this checkbox you can explicitly specify the printf style format to be used for numeric numbers values. To explicitly mark the values of interest, enable the "Use custom captions." You can specify exactly those marked values, which you want to display in the table that appears when you select this option.
The thickness of the color bar is used to control the thickness of the legend. It is defined in points in the same way as font size.
Use the Color Scale Length option to explicitly set the length color stripe. This property is defined as the fraction in the range [0, 1] window width (if the color legend is oriented horizontally) or height (for vertical orientation).