Search the documentation
Enter at least 2 characters
Enter at least 2 characters
 |
CAE Fidesys 9.0 Documentation |
The Color Editing property group determines how data is mapped with colors or transparency.
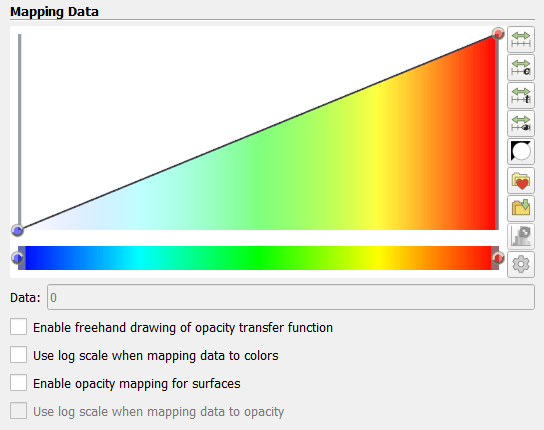
To use a logarithmic scale rather than a linear scale, you must Select the Logarithmic scale for color check box when displaying data. The data is assumed to be in a non-zero positive range. FidesysViewer will report errors and try to fix them automatically range if it is not valid for display.
The color map range is a very important property that controls display data values into colors.
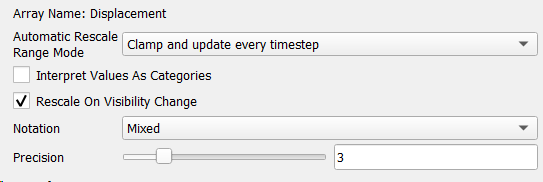
The way the range is updated is controlled by the Automatic Mode property. scaling" in the color map editor.