Search the documentation
Enter at least 2 characters
Enter at least 2 characters
 |
CAE Fidesys 9.0 Documentation |
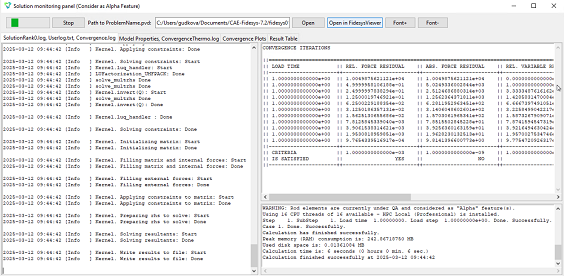
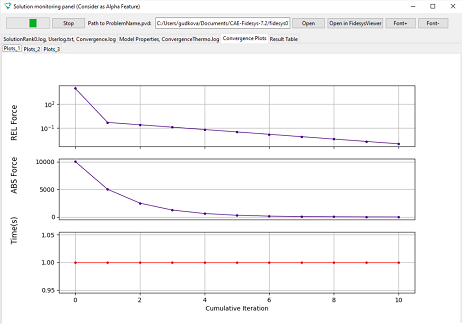
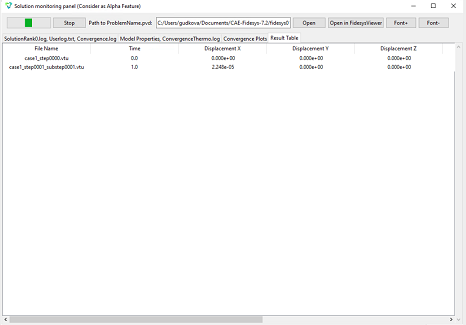
When running a nonlinear analysis with one or more types of nonlinearities (plasticity, geometric nonlinearity, general contacts) automatically the solution dashboard is launched, which allows real-time monitor the update of the solver log files, track the convergence process calculation and monitor the results for saved calculation steps/substeps in the results table.
The panel also contains additional buttons that allow you to open the current the volume of calculated results in the FidesysViewer post-processor, as well as change text size to improve readability or increase volume information on the screen.
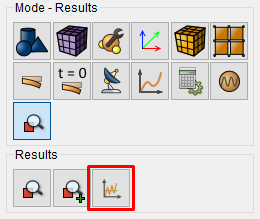
Also, the dashboard can be opened manually through the updated menu “Mode-Results” on the command bar.