Search the documentation
Enter at least 2 characters
Enter at least 2 characters
 |
CAE Fidesys 9.0 Documentation |
Changing filter properties in paraview
Changing filter properties in pvpython
Filters for geometric manipulation
Filters for attribute manipulation
In ParaView, filters are pipeline modules or algorithms that have inputs and outputs. They take in data on their inputs and produce transformed data or results on their outputs. A filter can have multiple input and output ports. The number of input and output ports on a filter is fixed. Each input port accepts input data for a specific purpose or role within the filter.
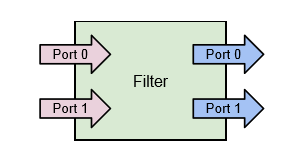
Figure 1 A filter is a pipeline module with inputs and outputs.
Data enters a filter through the inputs. The filter transforms the data and produces the resulting data on its outputs. A filter can have one or more input and output ports. Each input port can optionally accept multiple input connections.
An input port itself can optionally accept multiple input connections, e.g., the Append Datasets filter, which appends multiple datasets to create a single dataset only has one input port (named Input). However, that port can accept multiple connections for each of the datasets to be appended . Filters define whether a particular input port can accept one or many input connections. Similar to readers, the properties on the filter allow you to control the filtering algorithm. The properties available depend on the filter itself.
All available filters in paraview are listed under the Filters menu. These are organized in various categories. To create a filter to transform the data produced by a source or a reader, you select the source in the Pipeline Browser to make it active, and then click on the corresponding menu item in the Filters menu. If a menu item is disabled, it implies that the active source does not produce data that can be transformed by this filter.
When you create a filter, the active source is connected to the first input port of the filter. Filters like Append Datasets can take multiple input connections on that input port. In such a case, to pass multiple pipeline modules as connections on a single input port of a filter, select all the relevant pipeline modules in the Pipeline Browser. You can select multiple items by using the Ctrl and ↑ key modifiers. When multiple pipeline modules are selected, only the filters that accept multiple connections on their input ports will be enabled in the Filters menu.
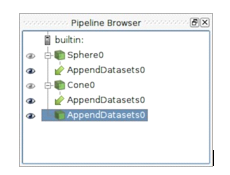
Figure 2 The Pipeline Browser showing a pipeline with multiple input connections. The Append Datasets filter has two input connections on its only input port, Sphere0 and Cone0.
Most filters have just one input port. Hence, as soon as you click on the filter name in the Filters menu, it will create a new filter instance and that will show up in the Pipeline Browser. Certain filters have multiple inputs that must be set up before the filter can be created. In such a case, when you click on the filter name, the Change Input Dialog will pop up, as seen in Figure 3. This dialog allows you to select the pipeline modules to be connected to each of the input ports. The active source(s) is connected by default to the first input port. You are free to change those as well.
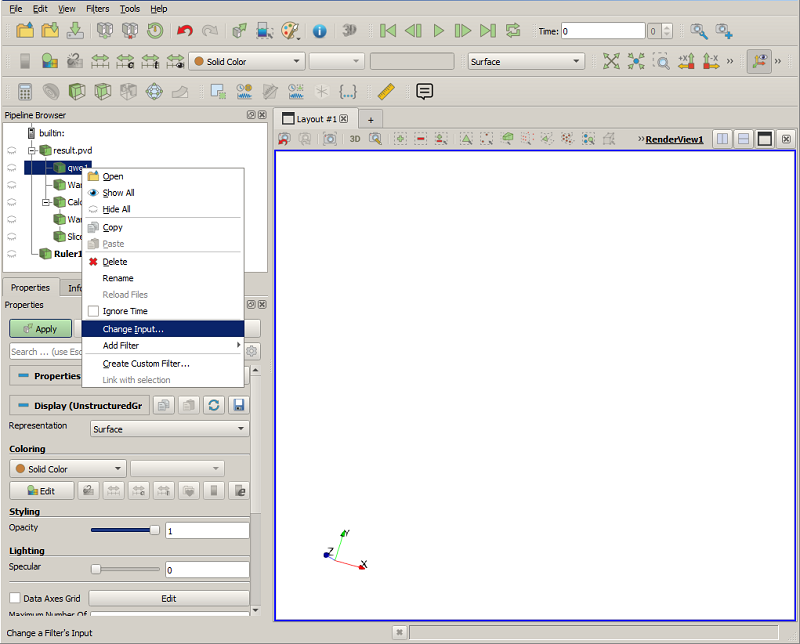
Paraview allows you to change the inputs to a filter after the filter has been created. To change inputs to a filter, right-click on the filter in the Pipeline Browser to get the context menu, and then select Change Input... This will pop up the same Change Input Dialog as when creating a filter with multiple input ports. You can use this dialog to set new inputs for this filter.
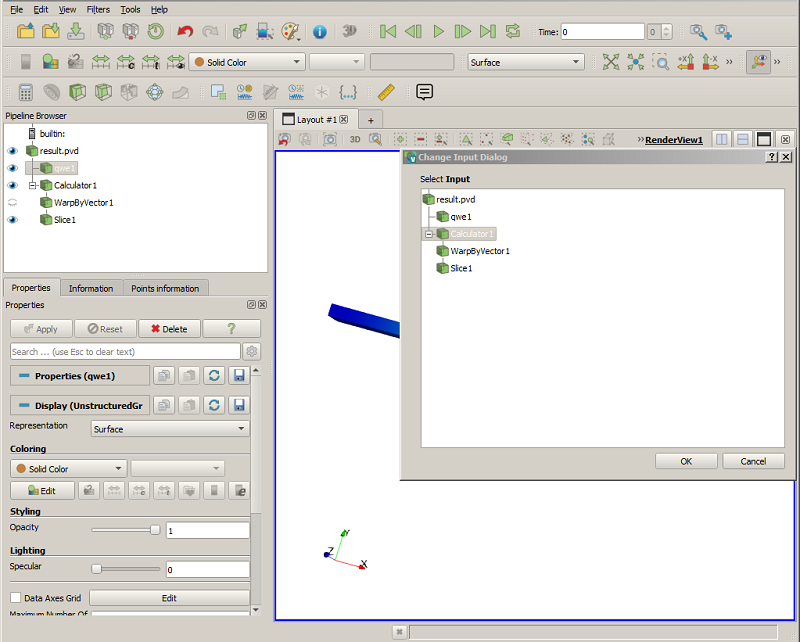
Figure 3 The Change Input Dialog is shown to allow you to pick inputs for each of the input ports for a filter with multiple input ports.
To use this dialog, first select the Input Port you want to edit on the left side, and select the pipeline module(s) that are to be connected to this input port. Repeat the step for the other input port(s). If an input port can accept multiple input connections, you can select multiple modules, just like in the Pipeline Browser.
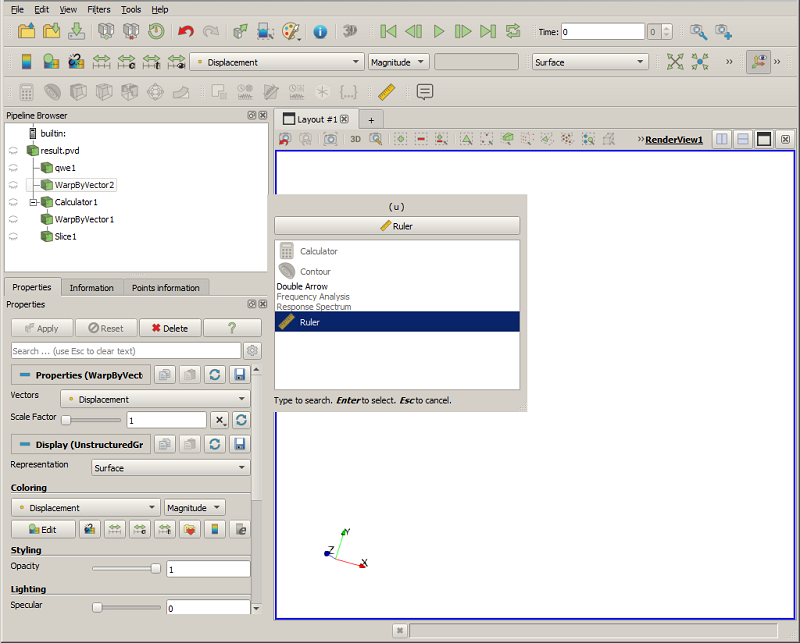
Figure 4 The context menu in the Pipeline Browser showing the option to change inputs for a filter.
While the Filters menu is a handy way to create new filters, with the long list of filters available in ParaView, manually finding a particular filter in this menu can be very challenging. To make it easier, ParaView incorporates a quick launch mechanism. When you want to create a new filter (or a source), simply type Ctrl + Space or Alt + Space. This will pop up the quick-launch dialog. Now, start typing the name of the filter you want. As you type, the dialog will update to show the filters and sources that match the typed text. You can use the arrow keys to navigate and use the Enter key to create the selected filter (or source). Note that filters may be disabled, as was the case in the Filters menu but by default the selected item will be the first enabled filter. You can use Esc to clear the text you have typed so far. Hit the Esc a second time, and the dialog will close without creating any new filter.
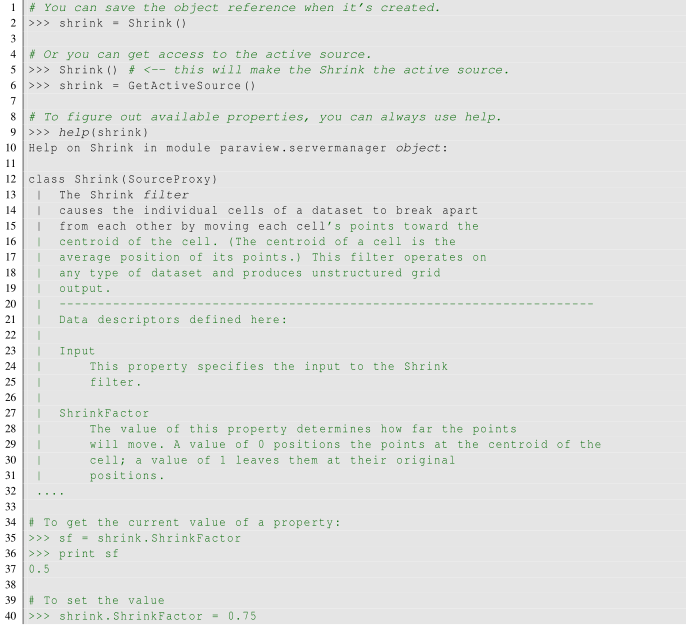
To create a filter in pvpython, you simply create the object by using its name as a constructor function.

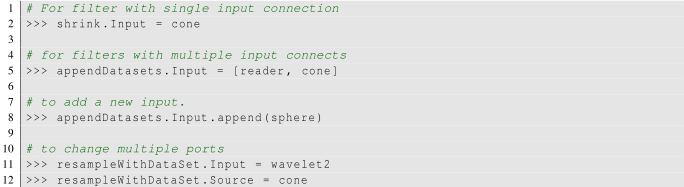
Similar to paraview, the filter will use the active source(s) as the input. Additionally, you can explicitly specify the input in the function arguments.

To setup multiple input connections, you can specify the connections as follows:

Setting up connections to multiple input ports is similar to the multiple input connections, except that you need to ensure that you name the input ports properly.

Changing inputs in Python is as simple as setting any other property on the filter.
Filters provide properties that you can change to control the processing algorithm employed by the filter. Changing and viewing properties on filters is the same as with any other pipeline module, including readers and sources. You can view and change these properties, when available, using the Properties panel. Since this panel only shows the properties present on the active source, you must ensure that the filter you are interested in is active. To make the filter active, use the Pipeline Browser to click on the filter and select it.
With pvpython, the available properties are accessible as properties on the filter object, and you can get or set their values by name.
These filters are used for extracting subsets from an input dataset. How this subset is defined and how it is extracted depends on the type of the filter. These filters include:
These filters are used to transform the geometry of the dataset without affecting its topology or its connectivity. These filters include:
These filters compute new datasets that represent some essential features from the datasets that they take as input. These filters include:
The filters covered in this section are used to add new attribute arrays to the dataset, which are typically used to add derived quantities to use in pipelines for further processing. These filters include:
This includes the Programmable Filterand Programmable Source. For these filters/sources, you can add Python code to do the data generation or processing.
If you use some filters more than others, you can organize them in the Filters Favorites menu. This can be done from the context menu in the pipeline or through the Filters Manage Favorites menu as shown in Figure 5. In this dialog you can create categories and subcategories. It supports drag’n’drop operation to sort and move filters and categories. Moreover, Favorites are highlighted in the other filter submenus on supported platforms. Favorites are saved in user settings so they can be used in other subsequent ParaView sessions.
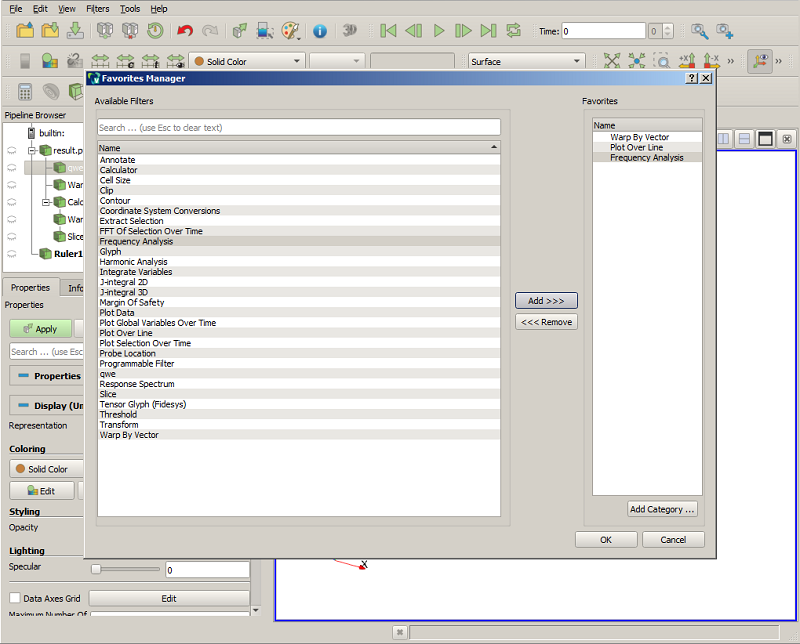
Figure 5 The Favorites Manager dialog. Left - the list of available filters. Right - the favorites, organized into categories.
The pipeline model that ParaView presents is very convenient for exploratory visualization. The loose coupling between components provides a very flexible framework for building unique visualizations, and the pipeline structure allows you to tweak parameters quickly and easily. The downside of this coupling is that it can have a larger memory footprint. Each stage of this pipeline maintains its own copy of the data. Whenever possible, ParaView performs shallow copies of the data so that different stages of the pipeline point to the same block of data in memory. However, any filter that creates new data or changes the values or topology of the data must allocate new memory for the result. If ParaView is filtering a very large mesh, inappropriate use of filters can quickly deplete all available memory. Therefore, when visualizing large datasets, it is important to understand the memory requirements of filters. Please keep in mind that the following advice is intended only for when dealing with very large amounts of data and the remaining available memory is low. When you are not in danger of running out of memory, the following advice is not relevant. When dealing with structured data, it is absolutely important to know what filters will change the data to unstructured. Unstructured data has a much higher memory footprint, per cell, than structured data because the topology must be explicitly written out. There are many filters in ParaView that will change the topology in some way, and these filters will write out the data as an unstructured grid, because that is the only dataset that will handle any type of topology that is generated. The following list of filters will write out a new unstructured topology in its output that is roughly equivalent to the input. These filters should never be used with structured data and should be used with caution on unstructured data.
Append Datasets
Append Geometry
Clean
Clean to Grid
Connectivity
D3
Delaunay 2D/3D
Extract Edges
Linear Extrusion
Loop Subdivision
Reflect
Rotational Extrusion
Shrink
Smooth
Subdivide
Tessellate
Tetrahedralize
Triangle Strips
Triangulate
Technically, the Ribbon and Tube filters should fall into this list. However, as they only work on 1D cells in poly data, the input data is usually small and of little concern. This similar set of filters also outputs unstructured grids, but also tends to reduce some of this data. Be aware though that this data reduction is often smaller than the overhead of converting to unstructured data. Also note that the reduction is often not well balanced. It is possible (often likely) that a single process may not lose any cells. Thus, these filters should be used with caution on unstructured data and extreme caution on structured data.
Clip
Decimate
Extract Cells by Region
Extract Selection
Quadric Clustering
Threshold
This next set of filters also outputs unstructured data, but it also performs a reduction on the dimension of the data (for example 3D to 2D), which results in a much smaller output. Thus, these filters are usually safe to use with unstructured data and require only mild caution with structured data.
Cell Centers
Contour
Extract CTH Fragments
Extract CTH Parts
Extract Surface
Feature Edges
Mask Points
Outline (curvilinear)
Slice
The filters below do not change the connectivity of the data at all. Instead, they only add field arrays to the data. All the existing data is shallow copied. These filters are usually safe to use on all data.
Block Scalars
Calculator
Cell Data to Point Data
Curvature
Elevation
Generate Surface Normals
Gradient
Level Scalars
Median
Mesh Quality
Octree Depth Limit
Octree Depth Scalars
Point Data to Cell Data
Process Id Scalars
Random Vectors
Resample with dataset
Surface Flow
Surface Vectors
Texture Map to...
Transform
Warp (scalar)
Warp (vector)
This final set of filters either add no data to the output (all data of consequence is shallow copied) or the data they add is generally independent of the size of the input. These are almost always safe to add under any circumstances (although they may take a lot of time).
Annotate Time
Append Attributes
Extract Block
Extract Datasets
Extract Level
Glyph
Group Datasets
Histogram
Integrate Variables
Normal Glyphs
Outline
Outline Corners
Plot Global Variables Over Time
Plot Over Line
Plot Selection Over Time
Probe Location
Temporal Shift Scale
Temporal Snap-to-Time-Steps
Temporal Statistics
There are a few special case filters that do not fit well into any of the previous classes. Some of the filters, currently Temporal Interpolator and Particle Tracer, perform calculations based on how data changes over time. Thus, these filters may need to load data for two or more instances of time, which can double or more the amount of data needed in memory. The Temporal Cache filter will also hold data for multiple instances of time. Keep in mind that some of the temporal filters such as the Temporal Statistics and the filters that plot over time may need to iteratively load all data from disk. Thus, it may take an impractically long amount of time even if does not require any extra memory. The Programmable Filter is also a special case that is impossible to classify. Since this filter does whatever it is programmed to do, it can fall into any one of these categories.
When dealing with large data, it is best to cull out data whenever possible and do so as early as possible. Most large data starts as 3D geometry and the desired geometry is often a surface. As surfaces usually have a much smaller memory footprint than the volumes that they are derived from, it is best to convert to a surface early on. Once you do that, you can apply other filters in relative safety. A very common visualization operation is to extract isosurfaces from a volume using the Contour filter. The Contour filter usually outputs geometry much smaller than its input. Thus, the Contour filter should be applied early if it is to be used at all. Be careful when setting up the parameters to the Contour filter because it still is possible for it to generate a lot of data which can happen if you specify many isosurface values. High frequencies such as noise around an isosurface value can also cause a large, irregular surface to form. Another way to peer inside of a volume is to perform a Slice on it. The Slice filter will intersect a volume with a plane and allow you to see the data in the volume where the plane intersects. If you know the relative location of an interesting feature in your large dataset, slicing is a good way to view it. If you have little a priori knowledge of your data and would like to explore the data without the long memory and processing time for the full dataset, you can use the Extract Subset filter to subsample the data. The subsampled data can be dramatically smaller than the original data and should still be well load balanced. Of course, be aware that you may miss small features if the subsampling steps over them and that once you find a feature you should go back and visualize it with the full dataset. There are also several features that can pull out a subset of a volume: Clip, Threshold, Extract Selection, and Extract Subset can all extract cells based on some criterion. Be aware, however, that the extracted cells are almost never well balanced; expect some processes to have no cells removed. All of these filters, with the exception of Extract Subset, will convert structured data types to unstructured grids. Therefore, they should not be used unless the extracted cells are of at least an order of magnitude less than the source data. When possible, replace the use of a filter that extracts 3D data with one that will extract 2D surfaces. For example, if you are interested in a plane through the data, use the Slice filter rather than the Clip filter. If you are interested in knowing the location of a region of cells containing a particular range of values, consider using the Contour filter to generate surfaces at the ends of the range rather than extract all of the cells with the Threshold filter. Be aware that substituting filters can have an effect on downstream filters. For example, running the Histogram filter after Threshold will have an entirely different effect than running it after the roughly equivalent Contour filter.